- 产品描述
科学软件网提供的软件上千款,涉及所有学科领域,您所需的软件,我们都能提供。科学软件网提供的软件涵盖领域包括经管,仿真,地球地理,生物化学,工程科学,排版及网络管理等。同时,还提供专业培训、课程(包含34款软件,66门课程)、实验室解决方案和项目咨询等服务。67. 分布拟合(多个变量) - 同时运行多个变量的分布拟合并考虑相关性和相关性的影响。68. 分布拟合(单个变量) - 对连续分布进行柯尔莫哥洛夫,斯米尔诺夫和卡方检验,生成完整的报告和分布假设。69. 假设检验 – 测试两个统计量是否统计显著相同或者有差异。70. 非参数拔靴法 - 对统计量进行模拟,以获取结果的精度和准确性。71. 覆盖图 – 对假设和预测生成完全定制的覆盖图(CDF,PDF, 2D/3D 图表类型)。72. 主成分分析 - 测试佳预测变量和方法,以减少数据的数组。73. 情景分析 – 可以生成数以万计的静态二维情景。74. 季节性测试 - 测试各种季节性滞后。75. 分割聚类 – 分割你的资料,将数据集纳入不同的统计类别。76. 敏感性分析 - 动态敏感性测试(同时进行分析)。77. 结构突变测试 - 测试你的时间序列数据是否有统计结构突变。78. 龙卷风分析 - 敏感性的静态扰动,蜘网分析和龙卷风分析,情景分析表格。Forecasting预测Box-Jenkins ARIMA、Auto ARIMA、基本计量、自动计量、 三次样条、自定义分布、 GARCH。J 曲线, S 曲线, 马尔科夫链, 大似然, 有限因变量(Logit, Probit,Tobit), 多元回归, 非线性外推法, 随机过程, 时间序列分解, 多元趋势线。Optimization优化连续变量、离散变量和整数决策变量的静态优化、动态优化和随机优化,有效*,项目组合选择,线性非线性优化。什么是风险分析?你如何制定关键的商业决策?你是考虑项目和决策的风险,还是较关注其收益?你是否经历过很难理解什么是风险,较不要说对风险进行量化?我们的RISK SIMULATOR软件将帮助你识别,量化,并对项目和决策中的风险进行评估。RISK SIMULATOR 是一个功能强大嵌于Excel的软件,可用于对现有的Excel电子表格模型进行仿真、预测、统计分析和优化。RISK SIMULATOR非常容易使用。例如,运行风险分析就和数1-2-3这样简单:设置输入变量,设置输出变量然后运行。进行预测分析也非常简单,只需点击鼠标两三次,软件会自动进行计算和分析,然后生成详细的报告,图表和数字结果。如果我们拥有可以将宇宙飞船送上太阳系的技术,为什么我们不可以花费多一点时间对风险进行分析和量化呢?我们已经拥有了这些技术,并将这些**方法整合到RISK SIMULATOR这个简单易用的工具之中。Basic Econometrics:The existing forecasting tool is now enhanced with new capabilities including the ability to create new variables and functions such as TIME (a linear time-series variable), DIFF (first differencing the time-series data set), RESIDUAL (data from the error term of a forecast equation you specify), RATE (first order ratio of time-series data), and FORECAST (data from the error term of a forecast equation you specify).ROV BizStats:A new module called ROV BizStats, which is a standalone tool that can be used to run basic to advanced statistical analyses at very high speeds. This new module includes the following 130+ methods:Absolute Values, ANOVA: Randomized Blocks Multiple Treatments, ANOVA: Single Factor Multiple Treatments, ANOVA: Two Way Analysis, ARIMA, Auto ARIMA, Autocorrelation and Partial Autocorrelation, Autoeconometrics (Detailed), Autoeconometrics (Quick), Average, Combinatorial Fuzzy Logic Forecasting, Control Chart: C, Control Chart: NP, Control Chart: P, Control Chart: R, Control Chart: U, Control Chart: X, Control Chart: XMR, Correlation, Correlation (Linear, Nonlinear), Count, Covariance, Cubic Spline, Custom Econometric Model, Data Descriptive Statistics, Deseasonalize, Difference, Distributional Fitting, Exponential J Curve, GARCH, Heteroskedasticity, Lag, Lead, Limited Dependent Variables (Logit), Limited Dependent Variables (Probit), Limited Dependent Variables (Tobit), Linear Interpolation, Linear Regression, LN, Log, Logistic S Curve, Markov Chain, Max, Median, Min, Mode, Neural Network, Nonlinear Regression, Nonparametric: Chi-Square Goodness of Fit, Nonparametric: Chi-Square Independence, Nonparametric: Chi-Square Population Variance, Nonparametric: Friedman’s Test, Nonparametric: Kruskal-Wallis Test, Nonparametric: Lilliefors Test, Nonparametric: Runs Test, Nonparametric: Wilcoxon Signed-Rank (One Var), Nonparametric: Wilcoxon Signed-Rank (Two Var), Parametric: One Variable (T) Mean, Parametric: One Variable (Z) Mean, Parametric: One Variable (Z) Proportion, Parametric: Two Variable (F) Variances, Parametric: Two Variable (T) Dependent Means, Parametric: Two Variable (T) Independent Equal Variance, Parametric: Two Variable (T) Independent Unequal Variance, Parametric: Two Variable (Z) Independent Means, Parametric: Two Variable (Z) Independent Proportions, Power, Principal Component Analysis, Rank Ascending, Rank Descending, Relative LN Returns, Relative Returns, Seasonality, Segmentation Clustering, Semi-Standard Deviation (Lower), Semi-Standard Deviation (Upper), Standard 2D Area, Standard 2D Bar, Standard 2D Line, Standard 2D Point, Standard 2D Scatter, Standard 3D Area, Standard 3D Bar, Standard 3D Line, Standard 3D Point, Standard 3D Scatter, Standard Deviation (Population), Standard Deviation (Sample), Stepwise Regression (Backward), Stepwise Regression (Correlation), Stepwise Regression (Forward), Stepwise Regression (Forward-Backward), Stochastic Processes (Exponential Brownian Motion), Stochastic Processes (Geometric Brownian Motion), Stochastic Processes (Jump Diffusion), Stochastic Processes (Mean Reversion with Jump Diffusion), Stochastic Processes (Mean Reversion), Structural Break, Sum, Time-Series Analysis (Auto), Time-Series Analysis (Double Exponential Smoothing), Time-Series Analysis (Double Moving Average), Time-Series Analysis (Holt-Winter’s Additive), Time-Series Analysis (Holt-Winter’s Multiplicative), Time-Series Analysis (Seasonal Additive), Time-Series Analysis (Seasonal Multiplicative), Time-Series Analysis (Single Exponential Smoothing), Time-Series Analysis (Single Moving Average), Trend Line (Difference Detrended), Trend Line (Exponential Detrended), Trend Line (Exponential), Trend Line (Linear Detrended), Trend Line (Linear), Trend Line (Logarithmic Detrended), Trend Line (Logarithmic), Trend Line (Moving Average Detrended), Trend Line (Moving Average), Trend Line (Polynomial Detrended), Trend Line (Polynomial), Trend Line (Power Detrended), Trend Line (Power), Trend Line (Rate Detrended), Trend Line (Static Mean Detrended), Trend Line (Static Median Detrended), Variance (Population), Variance (Sample), Volatility: EGARCH, Volatility: EGARCH-T, Volatility: GARCH, Volatility: GARCH-M, Volatility: GJR GARCH, Volatility: GJR TGARCH, Volatility: Log Returns Approach, Volatility: TGARCH, Volatility: TGARCH-M, Yield Curve (Bliss), and Yield Curve (Nelson-Siegel).19年来,公司始终秉承专业、专注、专心的发展理念,厚积薄发,积累了大量的人才、技术以及行业经验,在行业内得到了大量用户的认可和高度价。
科学软件网是一个以引进国外优秀科研软件,提供软件服务的营业网站,网站由北京天演融智软件有限公司创办,旨在为国内高校、科研院所和以研发为主的企业事业单位提供优秀的科研软件及相关软件服务。截止目前,科学软件网已获得数百家**软件公司正式授权,代理销售科研软件数百种种,软件涵盖领域包括经管,电力系统模拟,地球地理,生物化学,工程科学,排版及网络管理等。同时,还提供专业培训、视频课程(包含34款软件,66门课程)、实验室解决方案和项目咨询等服务。
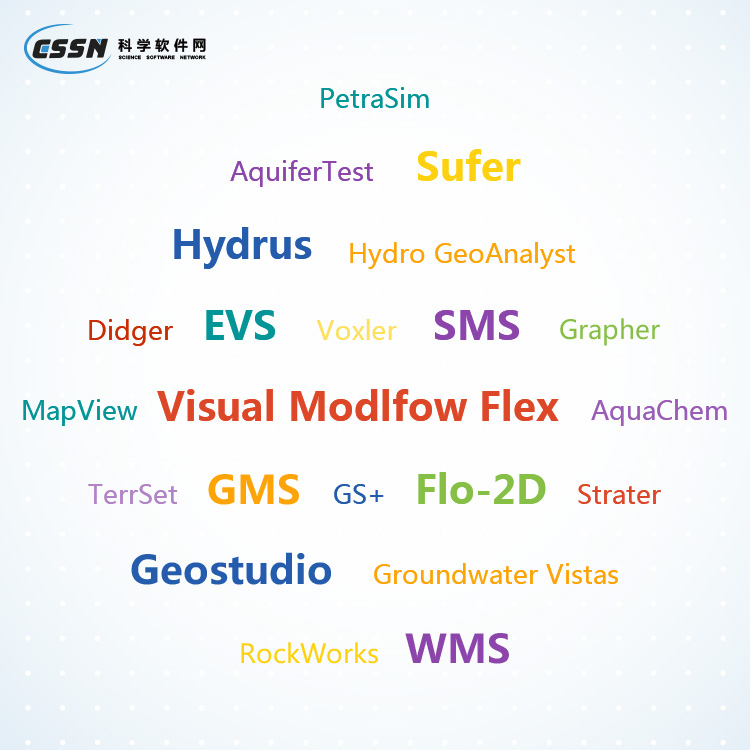
不管您是需要购买单款软件,还是制定整个实验室的购买方案,都可以提供。重点软件有:SPSS, Stata, Minitab, Matlab, GAMS, Mathematica, Tableau, SAS, LinGo, Mplus, @risk, Risk Simulator, EViews,NVivo/Atlas.ti/MaxQDA, 动态均衡模型,静态均衡模型,OxMetrics,Vensim/Ithink/Stella,Crystal Ball ,Alogit,GAUSS,GTAP,GEMPACK,HLM,Lisrel,NCSS,Netminer,Nlogit ,Stat/Transfer,SUDAAN,SYSTAT,TreeAge,PASS,nQuery,UCINET,RATS/CATS,Latent GOLD,Kwalitan,NeuroSolutions,TableCurvePSCAD,Enerplot,FACE,E-Tran,SIDRA TRIP,SIDRA INTERSECTION,Remo 3D,HOMER,Surfer,Grapher,Sigmaplot,GraphPad Prism,KaleidaGraph,Mapviewer ,Voxler ,Strater,Didger,RFFlowHydrus,GMS/SMS/WMS ,Visual Modflow,Flo-2d,Earth Volumetric Studio(EVS)Geostudio,RockWorks,PetraSim,AquaChem,AquiferTest,Hydro GeoAnalyst,Groundwater Vistas,TerrSetSequencher,SIMCA ,Wien2k,Q-chem,Chembiooffice ,Chembiodraw ,The Unscrambler ,Spartan,Array Designer ,Beacon Designer ,AlleleID ,Beacon Designer,Chemcraft,ChromasPro,CLIMEX DYMEX,Geneious,PC-ORD,Primer Premier,PrimerPlex ,RBCA Tool Kit for Chemical
欢迎来到北京天演融智软件有限公司网站,我公司位于拥有6项世界级遗产,拥有文化遗产项目数最多的城市,一座有着三千余年建城历史、八百六十余年建都史的历史文化名城,拥有众多历史名胜古迹和人文景观的中国“八大古都”之一 —北京。 具体地址是北京海淀公司街道地址,负责人是王经理。
主要经营北京天演融智软件有限公司主营产品spss、stata、matlab,科学软件网拥有近20年的软件销售经验,提供专业软件销售和培训服务,还有更多的增值服务。目前,科学软件网提供的软件有数百种,软件涵盖的。
我们的产品优等,服务优质,您将会为选择我们而感到放心,我们将会为得到您认可而感到骄傲。
本页链接:http://www.cg160.cn/vgy-56616092.html
以上信息由企业自行发布,该企业负责信息内容的完整性、真实性、准确性和合法性。阿德采购网对此不承担任何责任。 马上查看收录情况: 百度 360搜索 搜狗
关于北京天演融智软件有限公司
商铺首页 |
更多产品 |
联系方式
科学软件网是一个以引进国外优秀科研软件,提供软件服务的营业网站,网站由北京天演融智软件有限公司创办,旨在为国内高校、科研院所和以研发为主的企业事业单位提供优秀的科研软件及相关软件服务。截止目前,科学软件网已获得数百家**软件公司正式授权,代理销售科研软件数百种种,软件涵盖领域包括经管,电力系统模拟,..
- 我要给“risk simulator正版软件实用教程 保证正版”留言
- 更多产品
相关分类


